
Daniel Jones walks into Houston with most of his receivers somewhere else. Across his 16 logged starts, the ten players he targeted most drew 455 throws; four of them, Josh Downs, Keenan Allen, Alec Pierce and Michael Pittman, account for 235 of those and none is on tonight’s DraftKings slate. Pierce was the only one who stretched the field (a 19.7-yard average depth, 0.491 EPA per target), and Houston’s defense happens to leak deep, conceding 0.863 EPA per dropback to the deep right and 0.852 to the deep middle. Jones now has Tyler Warren at a 4.2-yard depth, Jonathan Taylor behind the line, and a short-area offense that has already thrown 207 times to the short left and short right for slightly negative EPA.
The market has noticed. Houston opened -5.5 and is now -12.5, a seven-point move toward a 3-6 team that lost to these same Colts 19-17 in Week 3 and lost 27-24 to Cleveland last week. To be fair to Houston, it has beaten somebody convincingly this season: Tennessee, 26-3. Our 20,000 simulations put the Texans’ win probability at 82.6% and the cover at 53.2%, so the new number is about right. The question for the showdown is who gets the points inside that score, and here we part from the crowd in three spots:
- Nico Collins is a yardage captain, not a touchdown bet. His ceiling is the best of any non-quarterback; his even-money touchdown price is twice what our model supports.
- Houston’s lead back is the touchdown the model likes. David Montgomery’s price is fair, even though his DFS ceiling doesn’t justify his ownership.
- Jonathan Taylor’s game-script discount has gone too far. At 15.2% projected ownership he carries the second-best non-QB ceiling on the slate.
Model vs. market: anytime touchdowns
We turned projected rushing and receiving touchdowns into a probability of scoring at least once and compared that with the best price at the six US books. Collins is the consensus touchdown of the week everywhere you look, which is exactly why his number is the one to check.
| Player | Best price | Market | Model | Ratio |
|---|---|---|---|---|
| Nico CollinsHOU · WR | +100 | 50.0% | 25.2% | 0.50 |
| Jonathan TaylorIND · RB | +130 | 43.5% | 32.2% | 0.74 |
| Dalton SchultzHOU · TE | +200 | 33.3% | 27.5% | 0.82 |
| Xavier HutchinsonHOU · WR | +240 | 29.4% | 16.1% | 0.55 |
| David MontgomeryHOU · RB | -111 | 52.6% | 57.3% | 1.09 |
| Emari DemercadoHOU · RB | +350 | 22.2% | 35.7% | 1.61 |
Collins at 0.50 is the widest miss among the starters. We project 7.9 targets and 65 yards for him, which is a lot, but 0.28 receiving touchdowns: Houston’s red-zone work spreads across Schultz, Hutchinson and two backs. Montgomery is the only starter whose price the model fully supports, on a projection of 17 carries, 70 yards and 0.79 rushing touchdowns with Woody Marks off the slate. Demercado’s 1.61 is the biggest gap on the board, but it is the same backfield seen through a backup’s role (9 projected carries). If you want Houston’s goal-line work, buy it through the lead back.
Model vs. market: ownership
The crowd is on Stroud, Montgomery and Schultz. Two of those three make sense. Stroud’s 29.1 ceiling leads the slate, and our sim has him for 1.82 touchdown passes. Montgomery is different: our Board gives him a 13.5 ceiling at $8,200, below Hutchinson’s 17.0 at $6,200. Our play-by-play sim, which weighs recent snap share, is even colder (5.3 mean), because he played 14% of snaps last week. He is a touchdown, not a tournament winner.
Taylor is where the field has overcorrected. He is 15.2% owned with a 23.8 ceiling, second only to Collins among non-quarterbacks, and the sim’s 90th percentile for him is 22.6 with a 46.2-point top end. A 12.5-point underdog still gives its lead back 16 simulated carries and nearly four targets, and Taylor’s 59 targets from Jones trail only Warren’s among players still on the roster. Hutchinson (10.5%) has the single highest simulated ceiling in the game at 47.2, which fits a receiver with an 11.1-yard depth facing a defense that concedes deep.
Our Board rates the Texans DST at 73.8 against 33.4 for Indianapolis. Houston has 33 sacks to the Colts’ 22, the sim has Jones taking 3.1 sacks, and Indianapolis is patching both tackle spots this week. At $5,800 and 11% owned it’s a legitimate flex if you skip a skill player.
Team context worth carrying
- Houston: Stroud’s offense averages 1.097 EPA on throws to the deep middle, and Indianapolis concedes 0.76 there and 0.737 to the deep left. Collins has 7 touchdowns and 0.521 EPA per target on 80 targets from Stroud at a 12.5-yard depth. That’s the case for Collins in DFS: yards and explosive plays, whoever catches the touchdown.
- Indianapolis: Jones’ offense has thrown 207 short passes outside the numbers against 11 to the deep middle. Houston’s soft spots are deep. The Colts’ passing game is built to avoid the exact area where this defense breaks, which is why we want Taylor and not Jones.
See the full showdown analysis. Captain board, every prop against our projection, the optimizer and exposure.
Captain and build
Collins is the captain. On a ceiling-weighted score (65% ceiling, 35% projection) he trails only Stroud, and the matchup points at his part of the field. At 28.4% overall he will be much less popular at captain than Stroud. Stroud goes in the flex, so we still get the passing game that comes with any big Collins night. Taylor is the Colts’ half of the bet: if Houston doesn’t run away with it, he’s the Colt with a real ceiling. Hutchinson fills the second Houston receiver spot rather than Schultz, for that 47.2 simulated ceiling at a fraction of Schultz’s ownership.
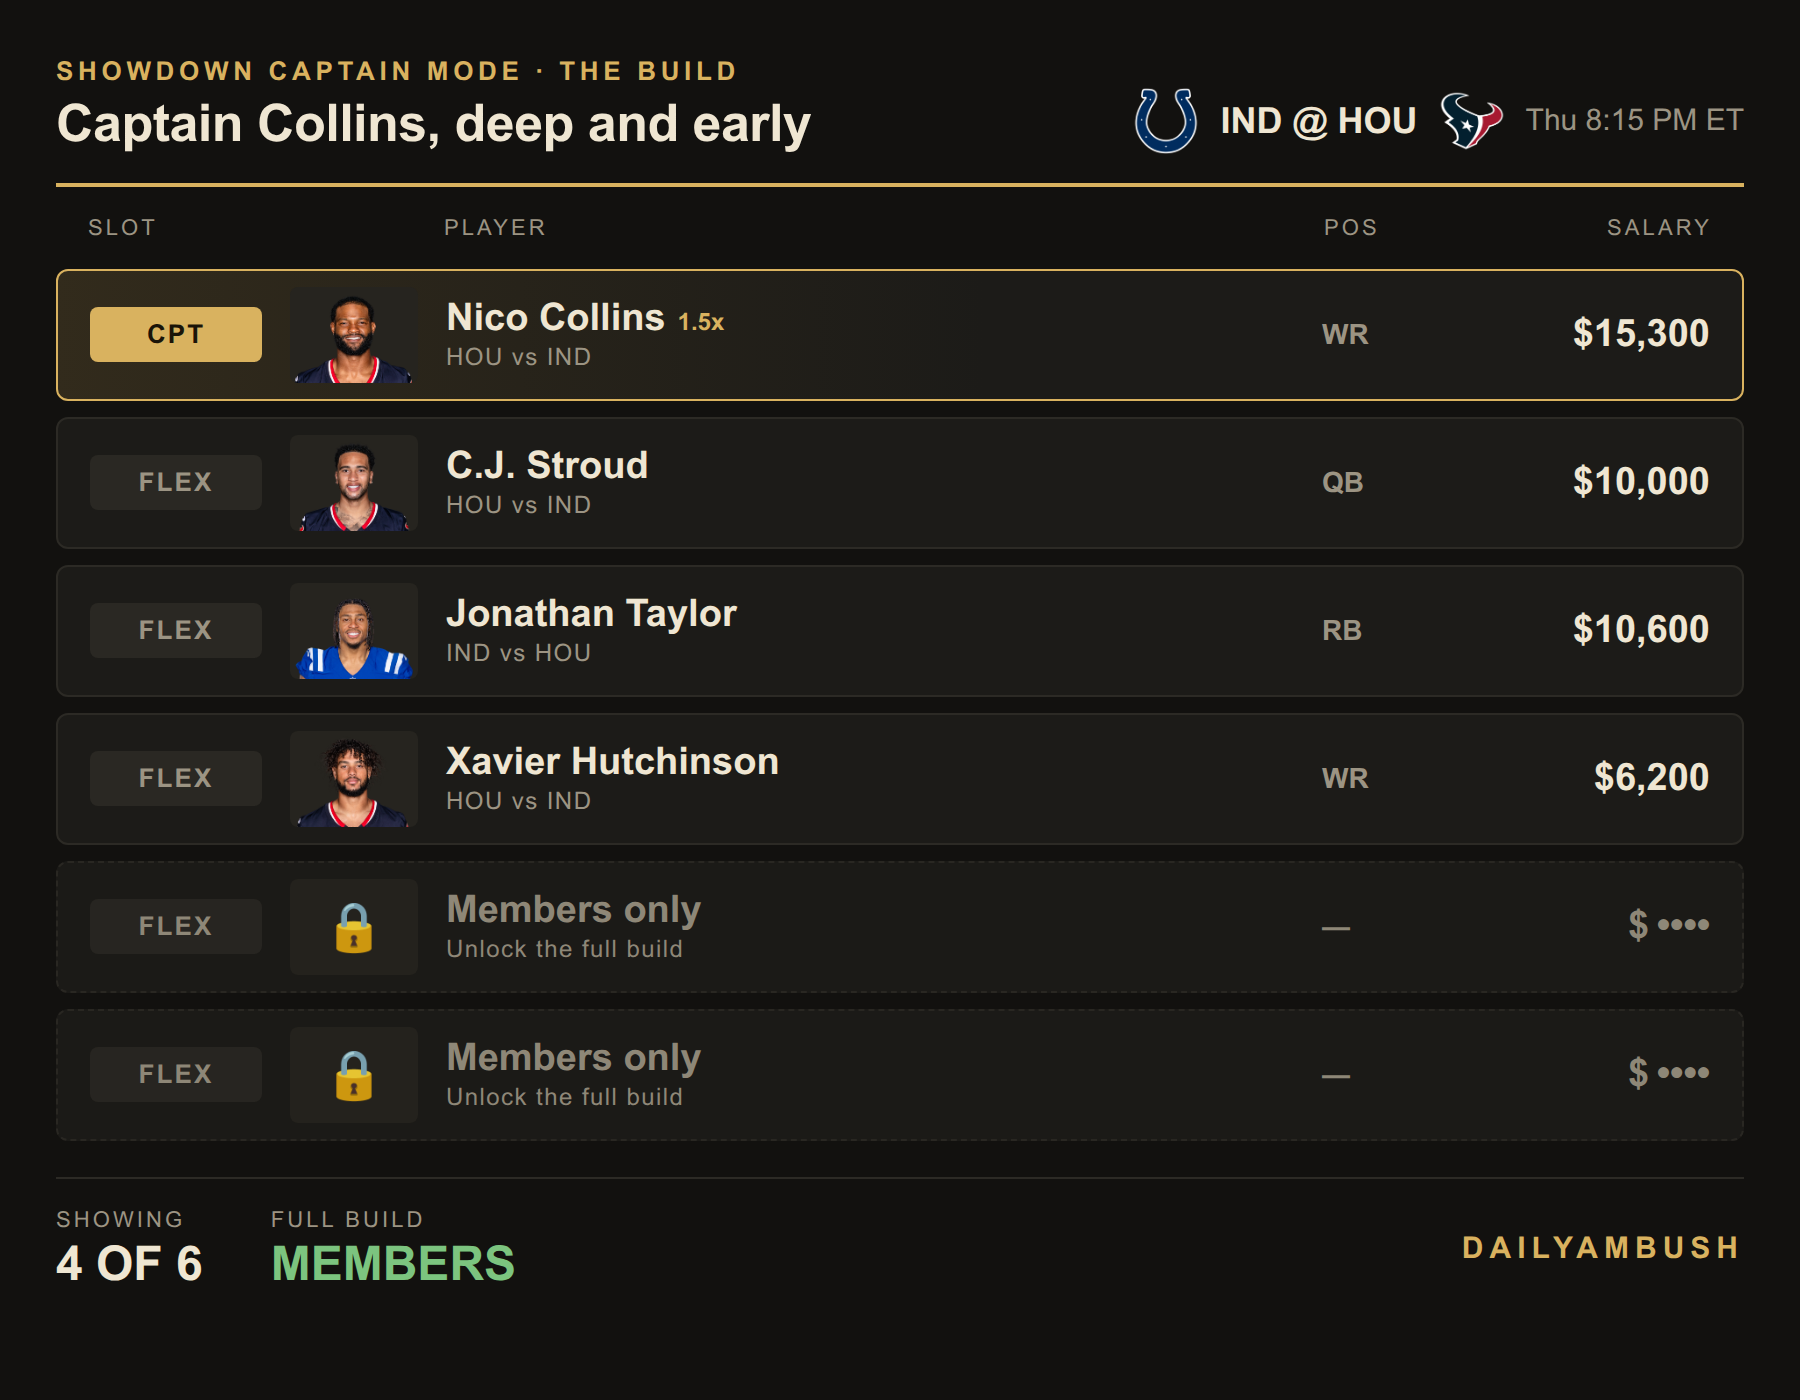
The last two spots are members-only. Get the full build, plus the Showdown Lab optimizer for your own.
The bets
- David Montgomery anytime TD, -111 (BetMGM; -127 at Caesars, -130 at FanDuel). Our model has him at 57.3% against 52.6% implied. He’s the lead back on a 28-point team total, he practiced fully, and Marks is off the slate. Shop it: at -135 the edge is gone.
- Colts moneyline, +570 (FanDuel; +550 at BetMGM and Hard Rock). The sim gives Indianapolis 17.4%, and +570 needs 14.9%. The seven-point move has pushed the dog price past what the game supports. Keep it small. This one loses most nights.
No captain touchdown bet. Collins is the right DFS captain at even money for the touchdown, and our model supports half that price. No spread either: our simulation has Houston covering 12.5 in 53.2% of runs, which isn’t enough after the vig.
Method: model touchdown probability = 1 − e−λ, where λ is projected rushing plus receiving touchdowns. Simulated numbers come from 20,000 runs of our play-by-play model around the market’s team totals. All numbers are from the DailyAmbush showdown ratings, projections and Bureau board as of Thursday morning. Lines move, so check your book before the 8:15 ET kickoff.