
Puka Nacua came back from his hip injury last week, and the Rams’ passing game reorganised itself around him in a single afternoon. He played 90% of the snaps, 20 points more than the week before, and the rotation behind him thinned out: Konata Mumpfield fell to 27% and Colby Parkinson to 43%. Buffalo is the stranger team. It has the most efficient offense on the field by a distance (0.298 EPA per play to the Rams’ 0.08) and a defense allowing 0.351 EPA per dropback, a number most offenses would frame and hang in the office. That is how a 3-1 team ends up a 3.5-point underdog with the money still coming its way: the line opened Rams -4.5.
The crowd has noticed the Rams. It hasn’t noticed which ones. Several of the most-rostered players in this pool are Los Angeles depth pieces, while the starters who actually score the points go at normal prices. Our projections and simulation part ways with the room on three things:
- Josh Allen’s touchdown: -120 at the books, about 21% in our projection. His passing line sits above both of our numbers too.
- James Cook: the field reads him as a back losing work. The model has him as the best-priced touchdown on the board.
- The cheap Rams: the ownership is on a part-time tight end and two backup running backs, not the players who drive the 29-point team total.
Model vs. market: anytime touchdowns
We turned projected rushing and receiving touchdowns into a probability of scoring at least once, then set it against the best price at the major US books. The ratio is how much of the market’s price our model supports.
| Player | Best price | Market | Model | Ratio |
|---|---|---|---|---|
| James Cook IIIBUF · RB | -105 | 51.2% | 56.1% | 1.10 |
| Kyren WilliamsLAR · RB | -155 | 60.8% | 57.9% | 0.95 |
| Blake CorumLAR · RB | +295 | 25.3% | 36.9% | 1.46 |
| Puka NacuaLAR · WR | -120 | 54.5% | 38.9% | 0.71 |
| Davante AdamsLAR · WR | +101 | 49.8% | 22.8% | 0.46 |
| Josh AllenBUF · QB | -120 | 54.5% | 21.1% | 0.39 |
Allen is the widest gap on the board. The books price him as more likely to score than not; we project 0.24 rushing touchdowns, and even the simulation, which is anchored to the Vegas totals, only gets him to 0.34. That isn’t a claim that he won’t score. It’s a claim that -120 is paying for the highlight reel. Cook is the reverse: 18 projected carries, 0.76 rushing touchdowns, and a price just under even money. Kyren Williams is fairly priced at 0.95, which is as good as a short favourite gets here.
Corum’s 1.46 is real arithmetic, and it is a backup’s arithmetic. He played 15% of the snaps last week. We’ll take the starter whose role produces the edge.
Model vs. market: ownership
The chalk is cheap and it is mostly Rams. Parkinson is on 62% of rosters at $2,400 after a 43% snap share; his simulated mean is 2.6 DK points. Dean Connors, the third running back, is also at 62% for $400 and projects for 0.75. Corum is at 50.5%. That is a lot of the field’s salary relief resting on players who need a touchdown to matter.
The expensive end is priced closer to right. Matthew Stafford at 48.5% is the field’s favourite play and a reasonable one: $9,000 for 20.4 projected points, and the simulation has him at 283 yards and 1.88 touchdowns against the softer pass defense. Allen is the top projection in the pool (22.4) at 17.4% owned, though much of that comes on the ground. Davante Adams at 5.8% is the starter the crowd has written off. With Nacua back he projects for 7.4 targets to Nacua’s 9.8, so the discount has a reason, but his 25.4 ceiling at $9,400 is not nothing.
Neither defense projects for more than 5.5 points. The Rams have only seven sacks and are without their best edge rusher, and the simulation has Buffalo allowing 1.54 sacks.
Team context worth carrying
- Buffalo: efficient but short. The simulation gives the Bills 54.3 plays and 28 pass attempts to the Rams’ 63.4 and 34. Allen’s best throws this season have gone deep (2.505 EPA to the deep right, 1.666 to the deep middle), and the Rams have allowed -0.126 EPA on their few deep-left throws. The one area where they give up real value is the short middle (0.211 EPA on 19 throws). That is Khalil Shakir’s ground, at a 3.9-yard aDOT across Allen’s starts.
- Los Angeles: across Stafford’s 16 logged starts, Nacua has 114 targets, 82 catches, 1,203 yards and 7 touchdowns, at 0.586 EPA per target. Buffalo concedes 0.71 EPA to the short middle and 0.679 to the deep right, the two areas a 9.7-yard aDOT lives in. Buffalo’s one lever is pressure: 10 sacks so far, 6.0 of them from Greg Rousseau.
See the full showdown analysis. Captain board, every prop against our projection, the optimizer and exposure.
Captain and build
Nacua is the captain. He has the highest ceiling in the pool (33.9), the best ceiling-weighted score of any player, and a projection of 9.8 targets, 77 yards and 21.6 DK points in his first full game back. He is on 28.9% of rosters in the flex, well behind Stafford and Williams. Stafford goes in the flex as the cheapest way to own the quarterback throwing him the ball. Kyren Williams has the touchdown price we fully support. Shakir is the Buffalo piece that fits the one area the Rams concede.
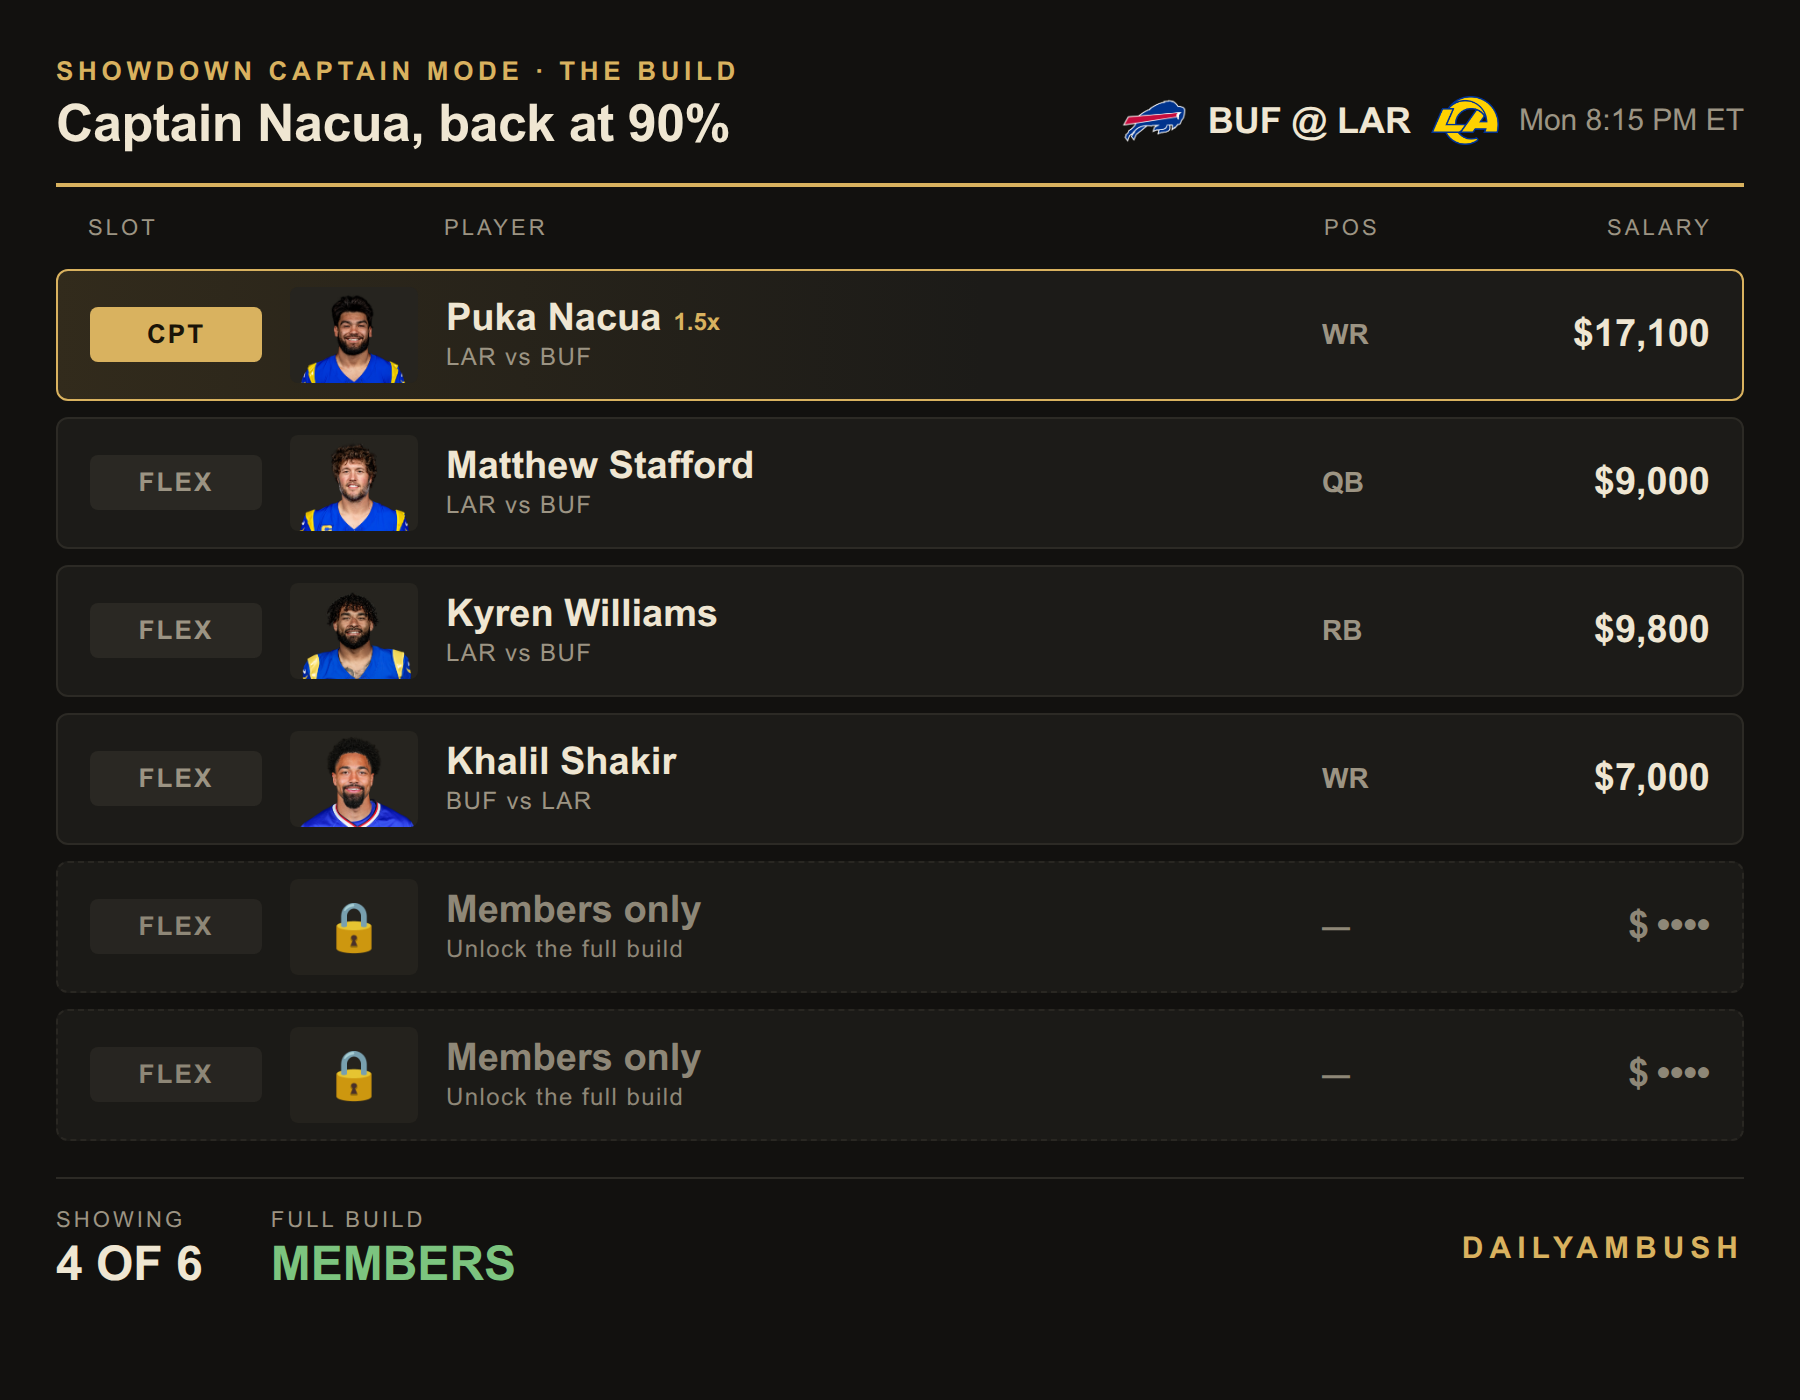
The last two spots are members-only. Get the full build, plus the Showdown Lab optimizer for your own.
The bets
- James Cook III anytime TD, -105 (DraftKings; -115 at FanDuel). Our model puts him at 56.1% against an implied 51.2%, and the simulation independently gives him 0.74 rushing and 0.15 receiving touchdowns. He is the lead back on a 25.5-point team total, and that role is where the edge comes from.
- Josh Allen Under 247.5 passing yards, -115 (BetMGM; 241.5 at -113 at DraftKings). We project 214 and the simulation 225, on 28 attempts against a pass defense allowing -0.088 EPA per dropback. Buffalo’s offense doesn’t run enough plays to get there through the air.
No captain touchdown this week. Nacua at -120 implies 54.5% and we have him at 38.9%, so he is a yardage and ceiling play, not a scoring bet. No total either. The simulation has the over at 48.3%, and the Under 54.5 at -102 at DraftKings clears breakeven by about a point, which is too thin to bet. Buffalo +3.5 covers 52.0% of the time in the simulation, and at -115 it needs 53.5%.
Method: model touchdown probability = 1 − e−λ, where λ is projected rushing plus receiving touchdowns. All numbers come from the DailyAmbush showdown ratings, projections, 20,000-run game simulation and Bureau board as of Monday afternoon. Lines move, so check your book before the 8:15 ET kickoff.