
Pittsburgh found its offense last Sunday by taking receivers off the field. Jaylen Warren played 90% of the snaps, Darnell Washington’s share jumped 23 points to 76%, and the third-receiver job shrank to part-time work: Germie Bernard dropped to 27% of snaps and Roman Wilson to 39%, which somehow didn’t stop Wilson from leading the team in targets. Cleveland went the other way, putting its rookie slot receiver KC Concepcion Jr. on the field for 86% of snaps and splitting the backfield almost down the middle. Both teams are 2-1, both won by three points last week, and the total has slid from 40.5 to 38.5. Thursday night football, in other words, in its natural habitat.
The crowd is building this game around the Browns’ quarterback and the Steelers’ biggest snap-count headline. Our 20,000 simulations at today’s lines (Pittsburgh 20.5, Cleveland 18) point somewhere else:
- Pittsburgh’s tight ends: the field is on the wrong one, by a wide margin.
- The quarterbacks: Deshaun Watson is projected at 47.7% owned and Aaron Rodgers at 13.6%, but the two finish within 1.5 points of each other in our simulations, and Rodgers has the higher ceiling.
- Warren’s rushing line: the books moved it to 70.5–75.5 yards after one big game. We have him at 58.
- Watson’s passing line: 185.5 at the low end. Our projection is 216.
Model vs. market: anytime touchdowns
We turned projected rushing and receiving touchdowns into a probability of scoring at least once and set it against the best price at the major US books. In a 38.5 total our model runs below the books on almost everyone, so the column that matters is the ratio: how much of the market’s price we can support.
| Player | Best price | Market | Model | Ratio |
|---|---|---|---|---|
| Jaylen WarrenPIT · RB | -105 | 51.2% | 40.9% | 0.80 |
| Quinshon JudkinsCLE · RB | +120 | 45.5% | 33.1% | 0.73 |
| Harold Fannin Jr.CLE · TE | +290 | 25.6% | 17.1% | 0.67 |
| DK MetcalfPIT · WR | +240 | 29.4% | 17.0% | 0.58 |
| Darnell WashingtonPIT · TE | +600 | 14.3% | 13.3% | 0.93 |
| Raheim SandersCLE · RB | +700 | 12.5% | 16.4% | 1.31 |
Warren at -105 is the most popular touchdown on the board, and our model supports 80% of it. That’s a fine number for a bell cow and not a bet at even money. Metcalf at 0.58 is the clearest overprice: his case is a 12.8-yard average depth of target and a 48-point simulated ceiling, not scoring. The touchdown market prices Washington almost exactly where we do, which matters for the next section. Sanders is the one price where our model sees more touchdown equity than the books do. His snaps went up 24 points to 43% last week and his targets went up by four, so the role is growing faster than the price.
Model vs. market: ownership
Washington is projected at 41.9% owned. Pat Freiermuth, the other Pittsburgh tight end, is at 3.3%. Our simulations reverse the order: Freiermuth averages 7.2 DraftKings points with a 90th percentile of 13.2, while Washington averages 4.0 with a 90th of 8.2. The snap share is real, but the targets don’t follow it: we have Freiermuth at 4.2 targets and Washington at 2.6, and Freiermuth has been the more productive receiver whenever Rodgers has thrown to him (more on that below). Nearly 39 points of ownership separate them.
Quarterback is the other gap. Watson is the most-owned player in the game, and with some reason: his legs add 7.2 carries for 32 yards in our simulations, and that gives him the best mean in the game. But Rodgers averages 16.1 points to Watson’s 17.6 and has the higher simulated ceiling (43.5 to 41.5) at a little over a quarter of the ownership. Quinshon Judkins at 6.5% is worth noting too. His snaps fell to 51% last week while Sanders’ rose, and the field has priced the time-share in fully. We think it’s overpriced it: Judkins’ 90th-percentile outcome (21.3) is within half a point of Warren’s.
Our Board rates Pittsburgh’s DST far ahead of Cleveland’s as a captain (78.5 vs. 21.5). The Steelers have 8 sacks and 18 quarterback hits through three games, and Cleveland comes in with its center and right guard both out.
Team context worth carrying
- Pittsburgh: Across Rodgers’ 16 starts in our play-by-play, his two most efficient targets are his tight ends: Freiermuth at 0.515 EPA per target and Washington at 0.36. Metcalf drew 93 targets and produced 0.121. Cleveland’s defense is giving up 0.801 EPA per pass to the short middle, its worst area (on only 10 attempts, so it’s early), and the short middle is where Pittsburgh’s offense has been most efficient (0.604 on 20).
- Cleveland: Pittsburgh’s defense has been beaten deep, at 1.918 EPA per pass to the deep right and 0.811 to the deep left. Denzel Boston is the Browns’ deep receiver, with a 15.0-yard average depth of target and 0.858 EPA on his 16 targets from Watson. His 50.2-point simulated ceiling is the highest of anyone in the game.
See the full showdown analysis. Captain board, every prop against our projection, the optimizer and exposure.
Captain and build
Rodgers is the captain. He’s the leverage at quarterback, he has the higher simulated ceiling, and Cleveland’s defense is weakest in the area where his offense is most efficient. Warren goes in the flex. He’s the top ceiling on our Board, but at 38.4% owned, a Warren captain is going to be the most common lineup in the contest. Freiermuth is the tight end, for the reasons above. Boston brings the game back the other way: if Cleveland keeps up, it’s most likely because of deep throws against that secondary.
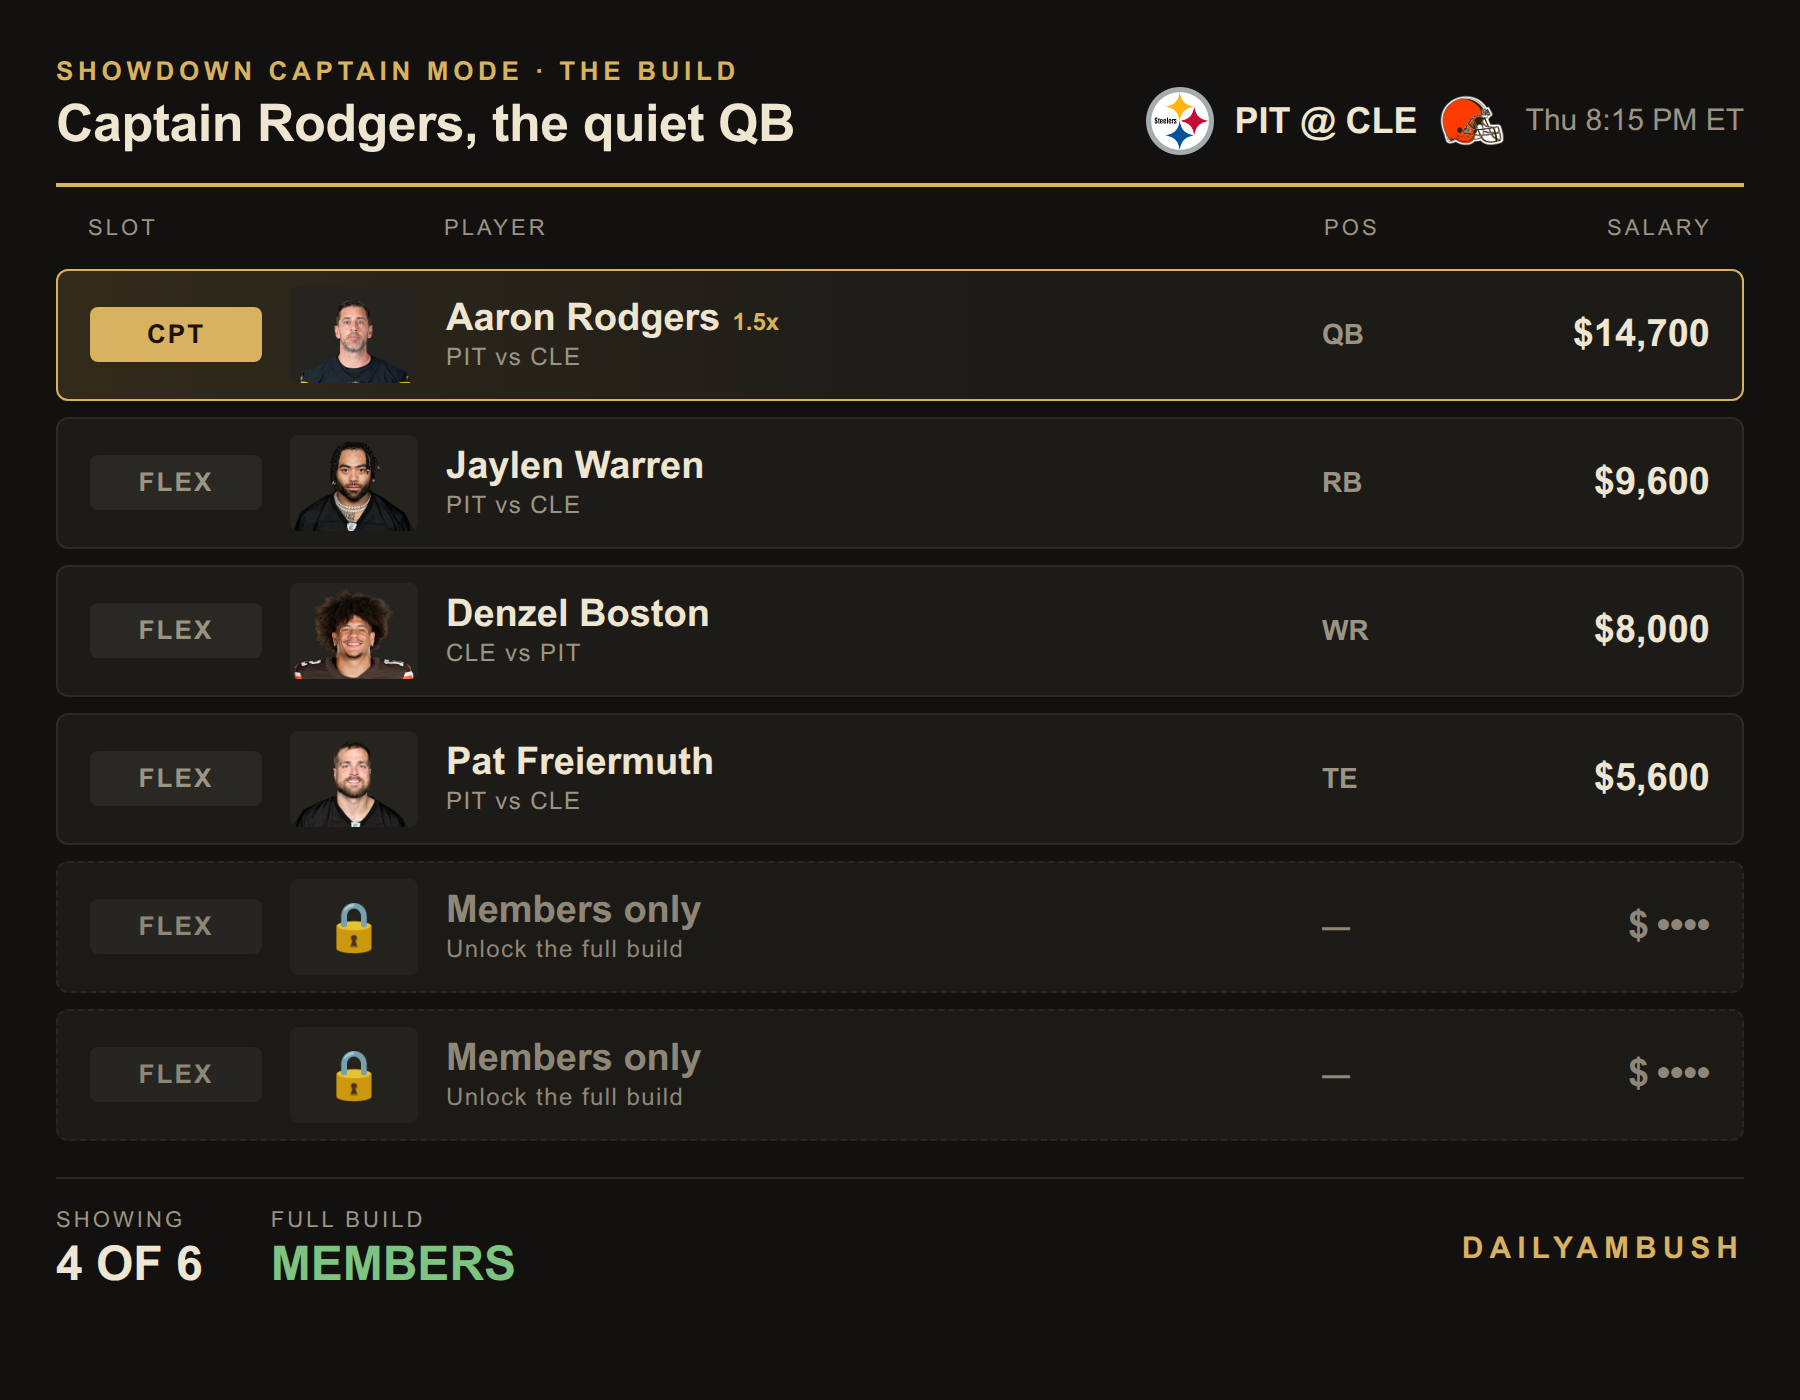
The last two spots are members-only. Get the full build, plus the Showdown Lab optimizer for your own.
The bets
- Jaylen Warren Under 75.5 rushing yards, -113 (FanDuel; 72.5 at DraftKings, 70.5 at BetMGM). This line opened at 65.5 and has moved ten yards on the strength of one 127-yard game. We project 58.6 and our simulations land at 57. Shop for the highest number you can find. The Under is the bet, not Warren himself.
- Deshaun Watson Over 185.5 passing yards, -110 (Fanatics; -113 at DraftKings). Our projection is 216 and the simulation mean is 213, on 27 attempts. Sacks are already in that number: the simulation accounts for a patched-up interior line and still has Watson about 28 yards over.
- Raheim Sanders anytime TD, +700 (DraftKings). 16.4% on our model against 12.5% implied, the only ratio on the board above 1. Keep the stake small, because it’s a growing role and not a guaranteed one.
No captain touchdown bet. Rodgers’ rushing touchdown price doesn’t hold up, and his Over 1.5 passing touchdowns at +162 is within a point of fair on our numbers. No side and no total either. Cleveland covers +2.5 in 48.6% of our simulations, and the Over 38.5 hits 51.1%, which at -105 is breakeven.
Method: model touchdown probability = 1 − e−λ, where λ is projected rushing plus receiving touchdowns. Simulated figures come from 20,000 runs of this game drawn around the Vegas team totals. All numbers are from the DailyAmbush showdown ratings, projections, simulations and Bureau board as of Thursday morning. Lines move, so check your book before the 8:15 ET kickoff.