
Lions at Bills carries a 54.5 total, and both the betting board and DFS ownership are priced for a quarterback shootout. Our projections see a different game, one where Buffalo leans on the run and both passing games come in under their lines. We disagree with the market in three places:
- Buffalo’s backfield: we project James Cook III for 100.0 rushing yards against a 78.5 to 81.5 line, and his touchdown price is the one our model fully supports.
- Josh Allen as a scorer: the market has him at 58.2% to find the end zone himself; we have him at 24.8%.
- The passing volume: we have Jared Goff at 227.6 yards against lines as high as 267.5, and Allen at 214.0 against 250.5.
Model vs. market: anytime touchdowns
We turned projected rushing and receiving touchdowns into a probability of scoring at least once and set it against the best price at the major US books. Our touchdown projections run lower than the books across most of the board, so the ratio is the number to read: the share of the market’s price our model supports.
| Player | Best price | Market | Model | Ratio |
|---|---|---|---|---|
| Jahmyr GibbsDET · RB | -295 | 74.7% | 52.3% | 0.70 |
| Amon-Ra St. BrownDET · WR | +115 | 46.5% | 30.5% | 0.66 |
| Josh AllenBUF · QB | -139 | 58.2% | 24.8% | 0.43 |
| DJ MooreBUF · WR | +165 | 37.7% | 20.6% | 0.55 |
| Ray DavisBUF · RB | +525 | 16.0% | 21.0% | 1.31 |
| James Cook IIIBUF · RB | -150 | 60.0% | 62.3% | 1.04 |
Allen is the widest gap on the board. His two rushing scores last week are why the field wants him at -139, but we project 0.285 rushing touchdowns, and every short run he doesn’t take goes to Cook, who sits at 0.975 combined. That makes Cook the one lead back priced fairly. Ray Davis rates even better, as does Sione Vaki at +1000, but both ratios depend on backup carries the Week 1 usage didn’t show, so we’re not betting either one.
Model vs. market: ownership
Projected ownership stacks up on Cook (51.8%) and Allen (48.7%), with Gibbs next at 34.7%. The ceilings are spread more evenly. St. Brown’s 31.26 ranks third in the pool at 12.7% owned, and Moore’s 23.56 leads Buffalo’s receivers at just 3.7%, while Khalil Shakir draws 21.5% with a 19.55 ceiling. Vaki is the trap: 30.3% owned for a 9.57 ceiling.
On defense, our Board rates the Bills DST at 78.50 and the Lions at 23.88. Detroit has ruled out its starting left guard and right tackle on a short week, with Greg Rousseau and Bradley Chubb waiting, and the Bills DST is 8.3% owned.
Team context worth carrying
- Detroit: Gibbs was on the field for every one of Detroit’s short-yardage and scoring-position snaps in Week 1. That’s the fact that keeps us off Vaki’s touchdown number.
- Buffalo: Cook handled 16 of the 18 running back touches in the opener. Our 20 projected carries for him aren’t a stretch.
See the full showdown analysis. Captain board, every prop against our projection, the optimizer and exposure.
Captain and build
On ceiling alone, Gibbs (36.59) and Allen (34.24) top the pool, but we’re captaining Cook. His fair touchdown price and a rushing projection 20 yards above the market are the thesis in one player, and at 1.5x he gets the most out of a Bills lead. We’re not getting ownership leverage at captain, so we find it in the flex: Allen and Gibbs as the salary anchors, with Moore’s low-owned ceiling beside them.
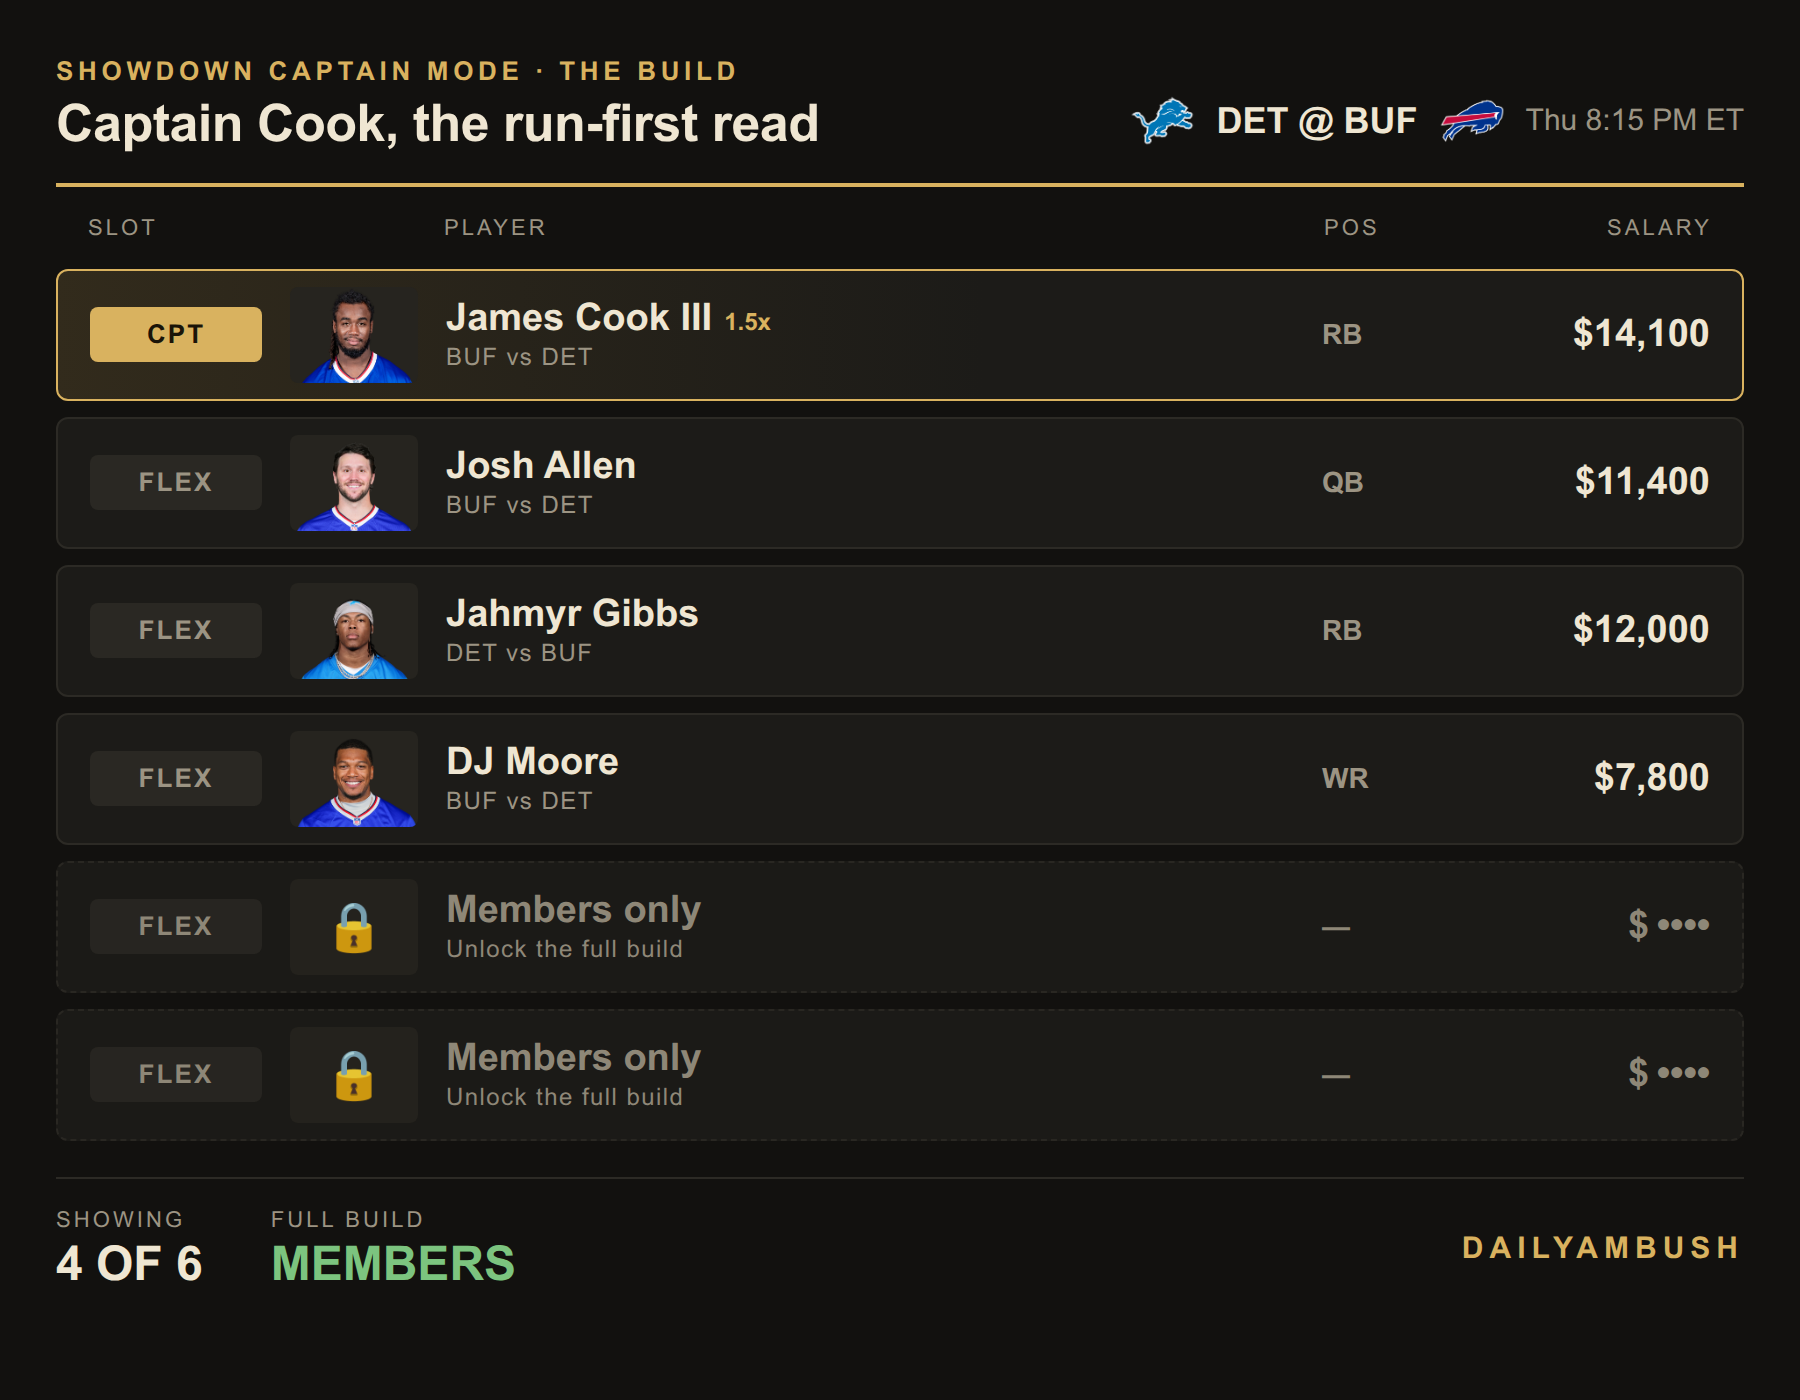
The last two spots are members-only. Get the full build, plus the Showdown Lab optimizer for your own.
The bets
- James Cook III anytime TD, -150 (Fanatics; -155 at BetMGM). We have him at 62.3% and the price implies 60.0%. The field is picking Allen to score instead.
- James Cook III Over 78.5 rushing yards, -113 (FanDuel; 79.5 at DraftKings). Our 100.0-yard projection clears the line by 21.5 yards, the biggest yardage gap on the board.
- Jared Goff Under 267.5 passing yards, -115 (BetMGM; 262.5 at DraftKings). We project 227.6, and he’s working behind a line missing two starters.
We aren’t betting a side or the total. The Bureau flagged Detroit’s moneyline at a book outside our six, but every one of our six has since moved to between +195 and +200, which erases the edge. The spread moved from 4.5 to 5.5 this week, and our passing projections argue against the Over more than our rushing ones support it.
Method: model touchdown probability = 1 − e−λ, where λ is projected rushing plus receiving touchdowns. All numbers are from the DailyAmbush showdown ratings, projections and Bureau board as of Thursday morning. Lines move, so check your book before the 8:15 ET kickoff.