
Drake Maye’s deepest target and his second-most-used one will both be in street clothes on Thursday. Romeo Doubs (a 17.6-yard average depth of target on Maye’s throws) is on injured reserve and Mack Hollins (47 targets, behind only Hunter Henry) is out. That leaves New England’s best area of the field this season, deep right at 0.969 EPA per throw on 22 attempts, facing a Chicago defense that gives up 0.778 per throw deep right and 1.55 down the deep middle. The matchup the Patriots most want is the one they have the fewest people left to run. The deepest remaining name on Maye’s target history is Kyle Williams, a $1,800 receiver on 0.9% of rosters. None of this has slowed them much: since a 35-6 loss in Jacksonville they have scored 100 points in three games, with Maye throwing 10 touchdowns and one interception.
Chicago is built the other way. Caleb Williams is back for a second straight week, and the Bears scored 59 and 31 in his two full games. In our simulation, though, the plan is the run: 36.6 rushing attempts to 28.2 passes, the most run-heavy shape on the field, and with Kyle Monangai out, D’Andre Swift carries most of it. The Bears’ defense is without both starting defensive ends, Montez Sweat (suspended) and Dayo Odeyingbo (injured reserve). That would matter more if New England weren’t expected to start backups at both guard spots. One pass rush and one offensive line are held together with tape, and they roughly cancel: the sim sacks Maye 2.6 times and Williams 2.1.
The betting market has already done the obvious work. The total is up four points since the open, from 46.5 to 50.5, and Chicago has moved from -1.5 to -3. In our 20,000 simulations the over lands 49.8% of the time and Chicago covers 47.6%, so both moves are priced in. The crowd is still wrong in three places:
- Chicago’s backfield: Swift has the volume and the one fairly priced touchdown on the board. He is our captain.
- Caleb Williams’ yardage: we project 207 passing yards and the sim lands on 210. The best line is 246.5.
- The cheap end of the ownership: Corey Kiner (54.5%) and Cole Kmet (24.9%) are popular salary savers that project for 2.98 and 3.74 points.
Model vs. market: anytime touchdowns
We turned projected rushing and receiving touchdowns into a probability of scoring at least once and compared it with the best price at the six books. Our touchdown projections run below the market almost everywhere, so the number that matters is the ratio: how much of the market’s price our model supports.
| Player | Best price | Market | Model | Ratio |
|---|---|---|---|---|
| D’Andre SwiftCHI · RB | -155 | 60.8% | 60.1% | 0.99 |
| Rhamondre StevensonNE · RB | -105 | 51.2% | 41.5% | 0.81 |
| Colston LovelandCHI · TE | +185 | 35.1% | 26.5% | 0.76 |
| Hunter HenryNE · TE | +240 | 29.4% | 21.1% | 0.72 |
| Luther Burden IIICHI · WR | +190 | 34.5% | 22.7% | 0.66 |
| Roschon JohnsonCHI · RB | +245 | 29.0% | 31.5% | 1.09 |
Swift is the only starter the model fully backs: 19 projected carries and 0.84 rushing touchdowns, in an offense whose other lead back is out. Stevenson at 0.81 is the best of the New England side, and New England’s run defense is the reason it stops there (−0.062 EPA allowed per carry). Roschon Johnson is the one row where our number beats the price, and we’re not betting it. That 31.5% is his slice of a run-heavy plan, not a role: he is the backup, and he lost a fumble last week. Burden at 0.66 is a yardage receiver; 51 catches from Williams have produced one touchdown.
Model vs. market: ownership
Five players are on at least 47% of rosters: Maye 62.0%, Kiner 54.5%, Swift 53.8%, Williams 49.0% and Stevenson 47.1%. Four of them are the four biggest roles in the game. Kiner is New England’s late-game clock-killer, a $1,400 back the sim gives 4.7 carries and a 3.7-point mean. Kmet is the other one: a quarter of the field is rostering him, and he leads every tight end in the league in run-blocking snaps. DraftKings doesn’t score those.
The ceiling the field isn’t paying for is Burden’s. He is on 4.9% of rosters, and his 44.6-point simulated ceiling is the third highest in the game, behind Maye and Swift. The honest knock is that his snaps fell to 39% last week, but his targets rose by two, and Williams has thrown to him 66 times, more than anyone except Loveland. Rome Odunze (11.8%, 11.0 projected) is the other underowned starter.
The defenses are close: Chicago at $4,000 projects 6.1 points to New England’s 5.3, both around 6% owned. Chicago’s edge is a protection problem on the other side. Its own missing edge rushers take most of that edge back.
Team context worth carrying
- Chicago: The Bears have allowed 9.3 points a game in their three home games, and all three went under. The market has pushed this total up four points anyway, and our sim lands right on the new number. That’s the reason we have no total bet, in either direction.
- New England: The Patriots are a pass funnel. They allow 0.196 EPA per dropback against −0.062 per carry, and 0.528 per throw over the short middle on 31 attempts. That’s where Chicago throws best among its short areas (0.387 on 54). It is the case for Loveland, who leads Williams’ target history with 82 targets (57-712-7). It is not the case for Williams’ yardage, because the sim doesn’t have Chicago throwing enough to need it.
See the full showdown analysis. Captain board, every prop against our projection, the optimizer and exposure.
Captain and build
Swift is the captain. On a ceiling-led ranking the top three are within 1.3 points of each other: Maye, Williams, then Swift. Swift is the one whose role grew this week. With Monangai out, the sim gives him 16.1 carries and 3.0 targets, and a 45.7-point ceiling, second only to Maye’s 47.1. Chicago runs the ball more than anyone on this field, and Swift is the back who carries it. Both quarterbacks go in the flex. That keeps Maye’s 62% at a single multiplier, and it lets us play Williams for the touchdowns (1.79 passing, 0.21 rushing projected) while we bet against his yardage. Loveland takes the fourth spot as the short-middle answer.
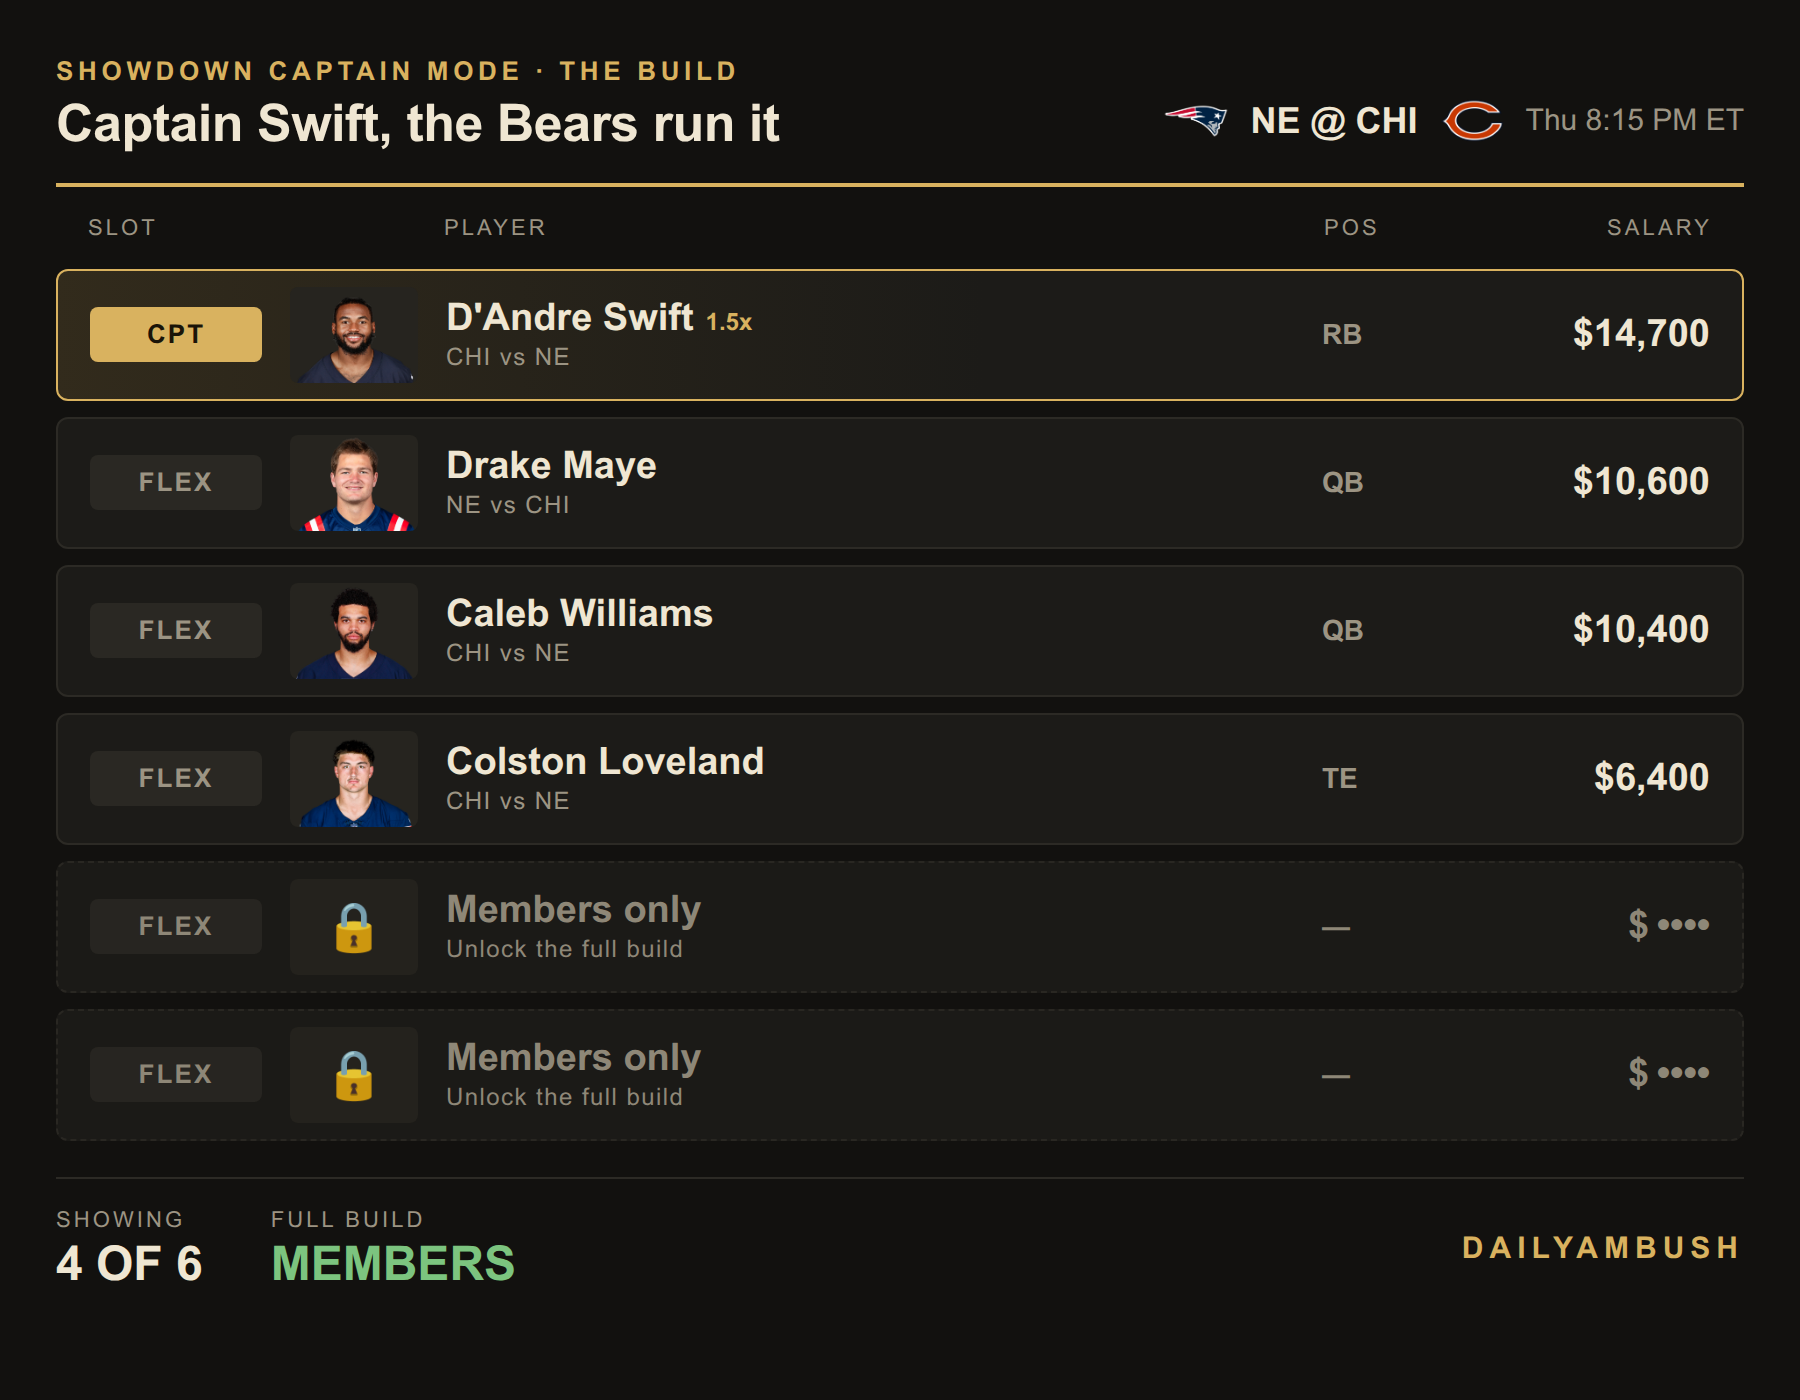
The last two spots are members-only. Get the full build, plus the Showdown Lab optimizer for your own.
The bets
- D’Andre Swift Over 60.5 rushing yards, -113 (FanDuel; -115 at BetMGM). We project 85.5 yards on 19 carries and the sim lands on 71 on 16. This is a volume bet, not an efficiency bet. Chicago has run for 3.0 and 3.6 yards a carry the last two weeks, and New England’s run defense is good. But 16 to 19 carries clears 60.5 at four yards a pop, and nobody else in this backfield is getting the work.
- Caleb Williams Under 246.5 passing yards, -111 (DraftKings). Our projection (207) and the sim (210 on 28 attempts) agree within three yards and sit 37 below the line. Getting there needs close to nine yards an attempt on the volume we expect. The line is pricing last week’s 36 attempts; the game plan we simulate doesn’t throw that much.
- D’Andre Swift anytime TD, -155 (BetMGM; -165 at DraftKings and FanDuel). The captain’s touchdown, at a fair price: 60.1% from our model against 60.8% from the market. There’s no edge here. It’s the price of agreeing with our own build, so keep it small.
No total and no spread. The total moved four points and the spread a point and a half this week, and our simulation lands within a couple of points of 50% on each. The market got there first.
Method: model touchdown probability = 1 − e−λ, where λ is projected rushing plus receiving touchdowns. All numbers are from the DailyAmbush showdown ratings, projections, 20,000-run game simulation and Bureau board as of Thursday morning. Lines move, so check your book before the 8:15 ET kickoff.