
Both of these teams have now played the same undrafted rookie quarterback. Green Bay beat him 17-14. Dallas lost to him 24-16, at home, four days later. That tells you most of what you need to know about the Cowboys’ defense, which is allowing 0.523 EPA per dropback, has five sacks and no interceptions in five games, and spent this week bringing in Mike Pettine as an “assistant” while its coordinator moved up to the booth. Nobody was fired. Somebody just got a window.
Green Bay’s defense looks better on paper (0.111 EPA allowed per dropback), but three of the five quarterbacks it has faced were backups, and the first of them still put 39 on it. Dak Prescott is the best passer it will have seen by a distance. The total has gone from 41.5 at the open to 53.5, and the spread from Green Bay -3 to -1.5. Our 20,000 simulations hold that shape: Green Bay wins 49.6% of them and the game goes over 50.3% of the time. The market has the game right. The DFS field has the players wrong, in four ways:
- The quarterbacks: Jordan Love is on 52.7% of rosters and Prescott on 23.1%, with projections three-tenths of a point apart.
- Green Bay’s backfield: MarShawn Lloyd is on 62% of rosters on the strength of last week’s two touchdowns, while our sim has him about five points behind Javonte Williams.
- Matthew Golden: the most targeted Packer in our simulation, owned like a WR4.
- Jake Ferguson’s touchdown price: the one anytime TD on the board our model rates above the market.
Model vs. market: anytime touchdowns
We turn projected rushing and receiving touchdowns into a probability of scoring at least once and set it against the best price at the six books. In a 53.5 total the books price nearly everyone aggressively, so read the ratio: how much of the market’s price our model supports.
| Player | Best price | Market | Model | Ratio |
|---|---|---|---|---|
| Javonte WilliamsDAL · RB | -185 | 64.9% | 53.7% | 0.83 |
| MarShawn LloydGB · RB | -140 | 58.3% | 55.4% | 0.95 |
| Christian WatsonGB · WR | +125 | 44.4% | 22.6% | 0.51 |
| George PickensDAL · WR | +155 | 39.2% | 26.3% | 0.67 |
| Matthew GoldenGB · WR | +170 | 37.0% | 17.9% | 0.48 |
| Jake FergusonDAL · TE | +285 | 26.0% | 27.8% | 1.07 |
Ferguson is the only price we’d pay. He played 83% of the snaps last week, up 12 points, and in Prescott’s last 16 starts he has eight touchdowns on 74 targets, more than any other Cowboy. Lloyd’s touchdown price is close to fair because he took every Green Bay carry inside the five last week; that is a different question from whether he is worth 62% of rosters (below). Watson and Golden are the two lowest ratios on the board. Their case is yardage and ceiling, not scoring at these prices.
Model vs. market: ownership
Love at 52.7% and Prescott at 23.1% is the cleanest gap in the pool. We project them at 20.3 and 20.0 points, with ceilings of 29.2 and 28.3. The crowd is pricing in Love’s 367 yards against Chicago last week and Dallas’s flat loss to Tampa Bay. It is not pricing in which defense each quarterback is about to play. Prescott throws into a secondary that has not faced a quarterback like him; Love throws at the worst pass defense on the field, with time, because Dallas gets home so rarely that our sim has him sacked about once.
Lloyd at 62.0% is the other one. He is averaging 2.8 yards a carry, and his value last week was two touchdowns, not volume. Our sim has him at 10.8 DK points. Williams, at 10.6% owned, simulates to 15.8, has six touchdowns in five games and handled every Dallas running back touch last week. A back on 62% of rosters is not automatically a workhorse.
Golden is the gap the field hasn’t noticed. At 4.6% owned he simulates to 16.3 points on 8.1 targets, more targets than Watson (7.4), with a 52.2-point ceiling. Our base showdown projection has him lower (13.2); the sim, built on this season’s target shares, where he leads the team, has him higher. Dallas concedes 0.849 EPA per attempt over the short middle, where his slot snaps have climbed two weeks in a row.
CeeDee Lamb carries a questionable tag into kickoff, so he is not in our build or our bets.
On defense, the Packers DST (5.6% owned) has 14 sacks and seven interceptions to Dallas’s five and zero, and our sim has Prescott sacked 3.2 times. It is the better of the two defenses by every number we have, at $400 more.
Team context worth carrying
- Dallas: In Prescott’s last 16 starts, Ferguson has eight touchdowns on 74 targets. CeeDee Lamb has seven on 144 and George Pickens five on 139. Prescott’s tight end is his red-zone target, and the touchdown market prices him like a safety valve.
- Green Bay: Love’s sim line is 295 yards on 34 attempts, against 274 for Prescott on 36. That’s the gap a five-sack pass rush makes. Green Bay throws less and gets more out of it.
See the full showdown analysis. Captain board, every prop against our projection, the optimizer and exposure.
Captain and build
Golden is the captain. Set the tagged Lamb aside and no non-quarterback in the pool has a higher simulated mean (16.3); add a 52.2-point ceiling and 4.6% ownership, and no other captain gives us that much upside for that little crowd. Love goes in the flex with him: if Golden pays at 1.5x, Love almost certainly threw for it. Prescott and Williams are the Dallas half, the two Cowboys our sim says score the most once the tagged receiver is set aside, and both come in at a fraction of their Green Bay counterparts’ ownership.
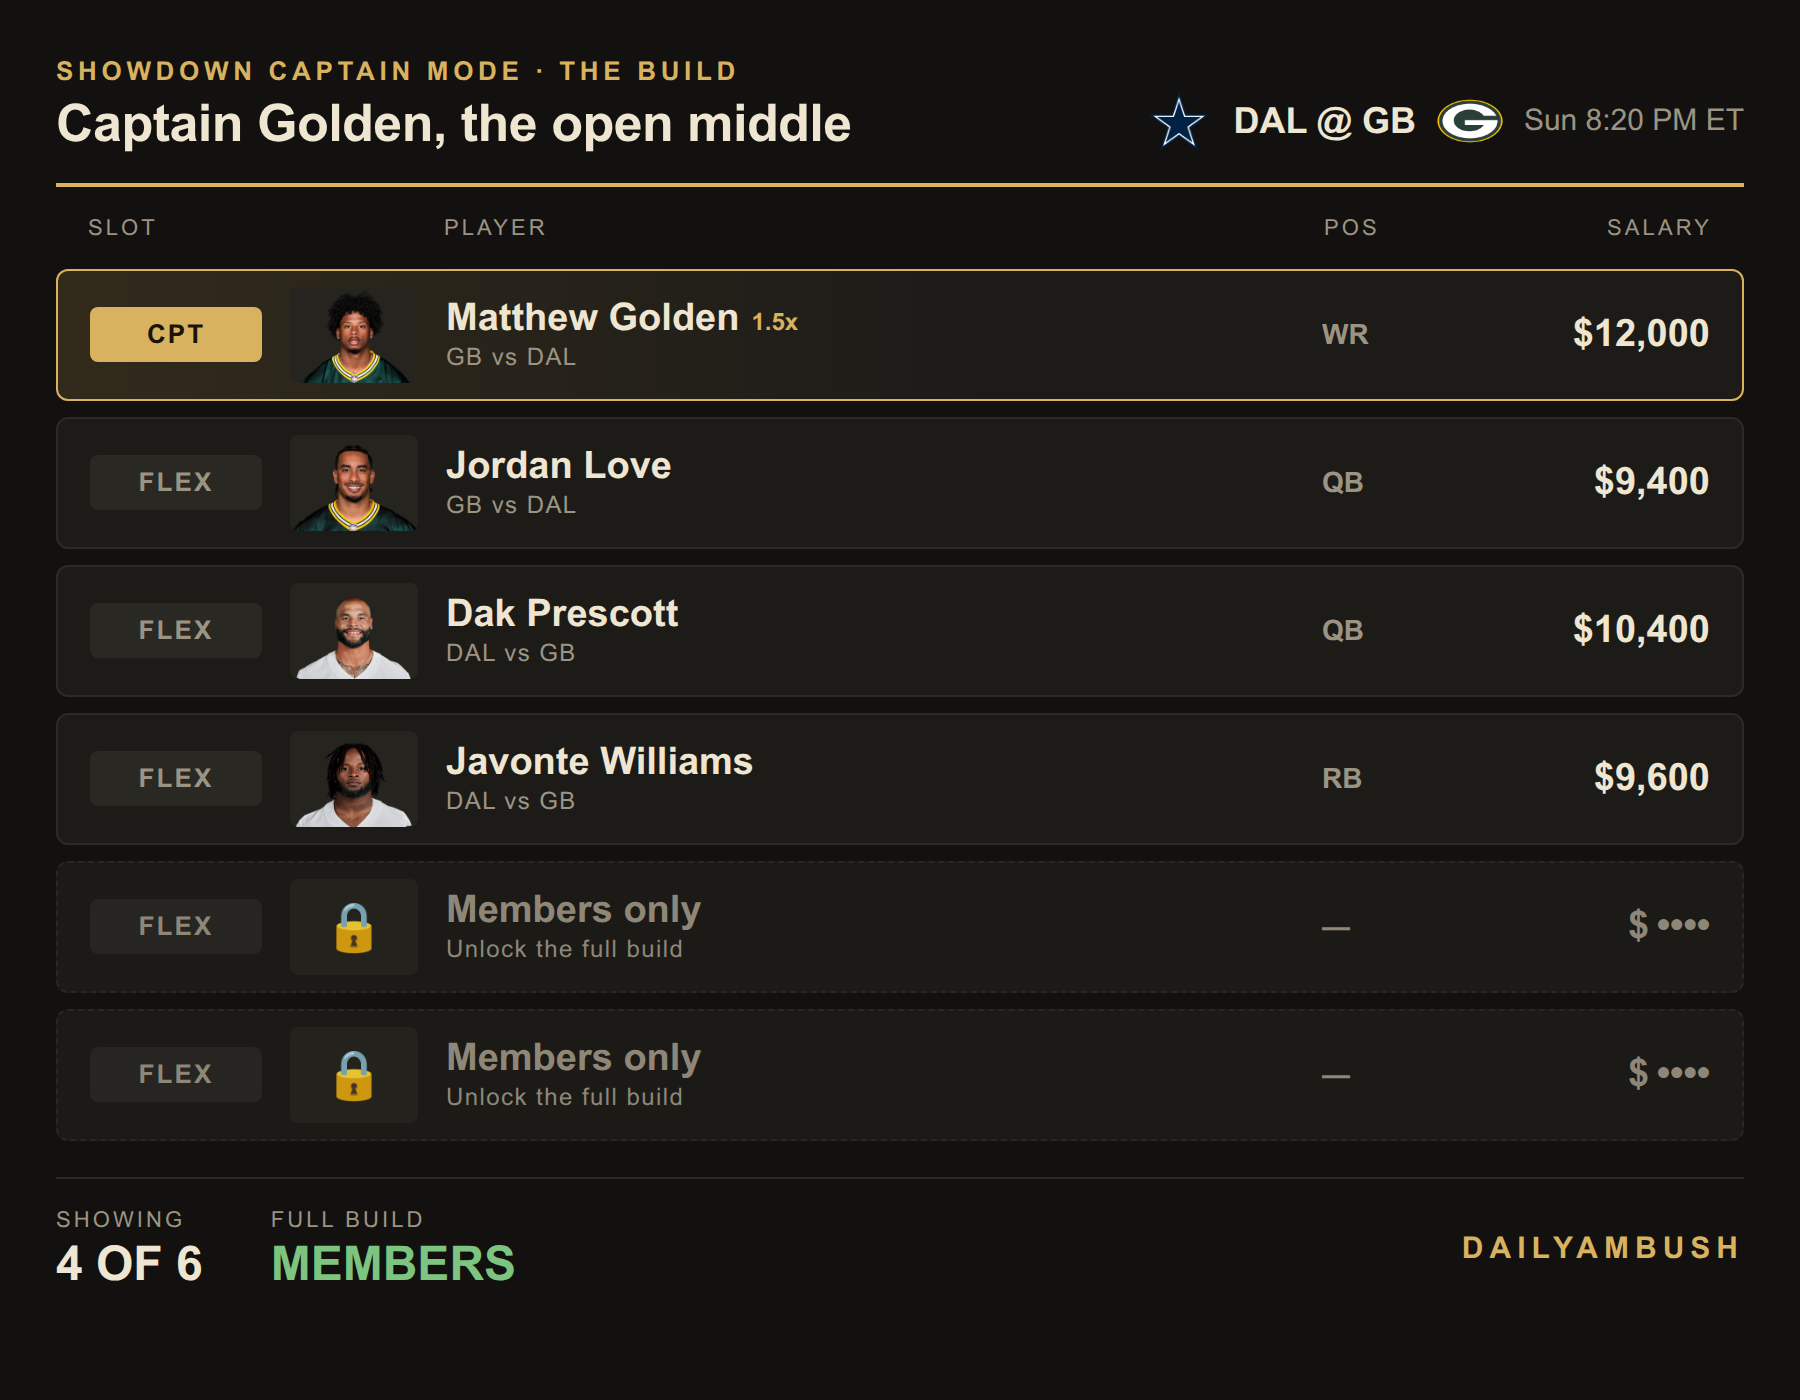
The last two spots are members-only. Get the full build, plus the Showdown Lab optimizer for your own.
The bets
- Jake Ferguson anytime TD, +285 (DraftKings; +280 at FanDuel). Our model has him at 27.8% against a 26.0% price. He’s a starter on 83% of the snaps with a quarterback who has thrown him eight touchdowns in 16 starts.
- Matthew Golden Over 65.5 receiving yards, -113 (FanDuel; 66.5 at DraftKings). The sim has him at 82 yards on 8.1 targets against the defense allowing the most EPA per dropback on the field. This is the bet that follows from the captain.
No captain touchdown. Golden’s +170 implies 37.0%; our projection has him at 17.9% and even the sim’s 35.6% falls short. No side and no total either: the simulation puts both within a point of 50%, which is what you’d expect when the totals are the market’s. This number moved twelve points to get here, and there is no edge left in it.
Method: model touchdown probability = 1 − e−λ, where λ is projected rushing plus receiving touchdowns. Simulated figures are from 20,000 runs of this game built on our play-by-play, with each team’s points drawn around its Vegas implied total. All numbers are from the DailyAmbush showdown ratings, projections and simulation as of Sunday afternoon. Lines move, so check your book before the 8:20 ET kickoff.