
Two markets price Colts at Chiefs, and both read the same script: Kansas City controlling a wet, run-first game at Arrowhead, with a 72% chance of showers at kickoff and a total settled at 46. Our ratings don’t argue with the script. They argue with who gets paid for it, in three places:
- The touchdown board: the model supports 70 to 76 cents of every headline price, then flips to 171 on Kansas City’s second back.
- Ownership: Jonathan Taylor grades within a rounding error of Patrick Mahomes on ceiling, at a fifth of the ownership.
- Indianapolis’ receiving split: we project 58.1 yards for Alec Pierce and 33.1 for Josh Downs. The market has that backwards.
Model vs. market: anytime touchdowns
Projected rushing and receiving touchdowns convert into a probability of scoring at least once, which we set against the best price at the six US books. Our touchdown projections run low across the board, so the number to read is the ratio — how much of the market’s price the model actually supports.
| Player | Best price | Market | Model | Ratio |
|---|---|---|---|---|
| Kenneth Walker IIIKC · RB | -185 | 64.9% | 49.1% | 0.76 |
| Jonathan TaylorIND · RB | -140 | 58.3% | 40.8% | 0.70 |
| Rashee RiceKC · WR | +160 | 38.5% | 29.1% | 0.76 |
| Travis KelceKC · TE | +210 | 32.3% | 24.2% | 0.75 |
| Tyler WarrenIND · TE | +250 | 28.6% | 21.0% | 0.73 |
| Emmett JohnsonKC · RB | +500 | 16.7% | 28.5% | 1.71 |
Five of the six cluster between 0.70 and 0.76, which is our normal offset and not a signal. Emmett Johnson is the exception at 0.289 projected rushing touchdowns, and at +500 that is the widest gap on the board. We are passing on it anyway.
Our model made this same call in Week 1 against Denver and lost: Johnson ran eight times for 24 yards and never threatened the end zone. The shape of the miss matters more than the miss. Kansas City ran four snaps inside the 10 that night and Johnson took none — Walker took three and scored. Our number leans on short-yardage work we have not seen him get, so this stays a model reading we can’t confirm rather than a play. Walker at -185 is the mirror image — our highest-probability scorer at a number we can’t take.
Model vs. market: ownership
Projected ownership piles onto the obvious: Harrison Butker 48.1%, Mahomes 47.0%, Rashee Rice 39.3%. Weight ceiling at 65% and projection at 35% and the pool looks nothing like that. Kenneth Walker III grades first at 25.5 and Mahomes second at 24.5, but Taylor is third at 24.3 while drawing 8.1%. Thirty-nine points of ownership separate two players our Board can barely tell apart, and Taylor handled 96% of his backfield’s touches in Week 1.
The defenses invert the same way. Our Board rates the Chiefs DST at 59.5 against Indianapolis’ 42.9, projects it higher (6.7 to 5.1) with the bigger ceiling, and the field has it 22.3% on the Colts to 6.6% on Kansas City. The home favorite with the better pass rush is the cheaper one to be different with.
Team context worth carrying
- Kansas City: exactly two running backs have reached 90 rushing yards against this defense since the start of the 2024 season. That is the case against Taylor’s ceiling, and the reason he’s a flex here and not the captain.
- Indianapolis: Tyler Warren has been targeted on 21% of his routes with Pierce on the field, and 30% with Pierce off it. Pierce is playing, which caps Warren in the same breath that it unlocks the deep shots.
See the full showdown analysis. Captain board, every prop against our projection, the optimizer and exposure.
Captain and build
Walker captains this on ceiling rather than value: 29.5 is the top mark in the pool, and 22.7% ownership is under half what Mahomes carries. Mahomes slots into the flex, where the arm still pays without handing us the same multiplier a third of the field already owns. Taylor and Travis Kelce fill in behind them, because the opposing bell cow and the check-down are how a game like this actually puts up points.
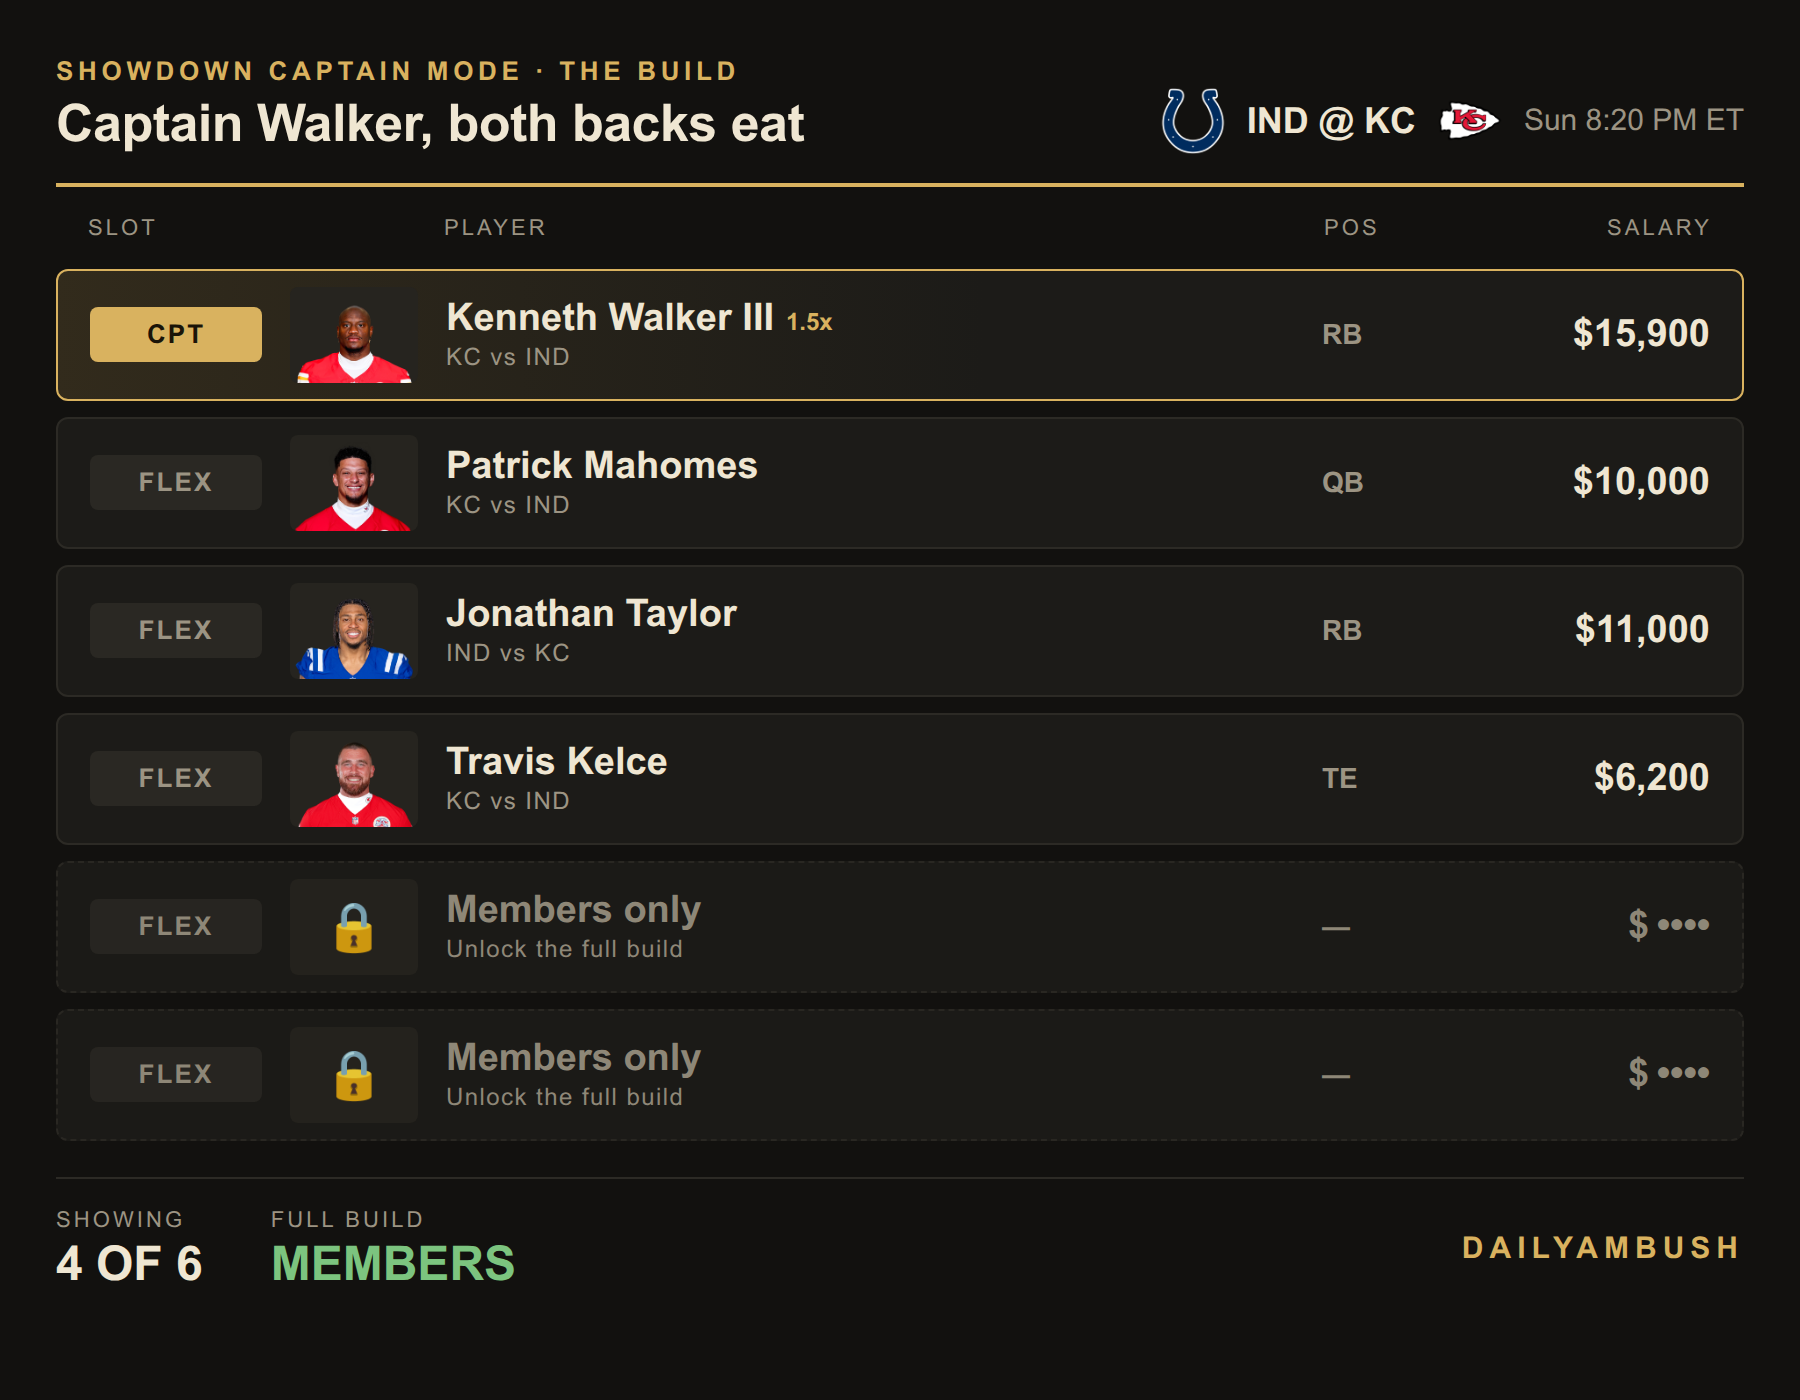
The last two spots are members-only. Get the full build, plus the Showdown Lab optimizer for your own.
The bets
- Josh Downs Under 4.5 receptions, -162 (DraftKings). We have the Under at 71% against a market price near 62%. Our projection is 3.6 catches on 5.5 targets, and a road underdog throwing in the rain is not the spot to pay up for slot volume.
- Alec Pierce Over 41.5 receiving yards, -113 (DraftKings). The number has walked down from 44.5 across the day while we project 58.1. On a vertical route tree, one catch clears it.
Method: model touchdown probability = 1 − e−λ, where λ is projected rushing plus receiving touchdowns. All numbers are from the DailyAmbush showdown ratings, projections and Bureau board as of Sunday afternoon. Lines move, so check your book before the 8:20 ET kickoff.